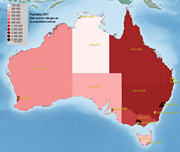
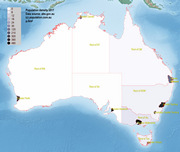
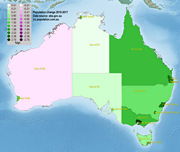
Greater Capital City Statistical Areas (abbreviated as GCCSA) are designed to represent the functional extent of each of the eight State capital cities. They include the people who regularly socialise, shop or work within the city, but live in the small towns and rural areas surrounding the city. GCCSAs are not bound by a minimum population size criterion. GCCSAs are built from statistical area level 4 (SA4). [1]


Population [people], population density [p./km²] and population change [%/year] [2]
GCC areas in ABC order:
[1] Read more about GCCSA on abs.gov.au
[2] Population data from Australian Bureau of Statistics (Population and density: 2017; change: 2016-2017) retrieved: 2018-11-26
[3] Digital Boundaries: Australian Statistical Geography Standard (ASGS) 2016.