Last official estimated population of Gingin Shire (as Local Government Area) was 5 308 people (on 2017-06-30)[2]. This was 0.02% of total Australian population and 0.205% of WA population. Area of Gingin is 3 208.40 km², in this year population density was 1.65 p/km² . If population growth rate would be same as in period 2016-2017 (-0.32%/yr), Gingin population in 2025 would be 5 174. [0]
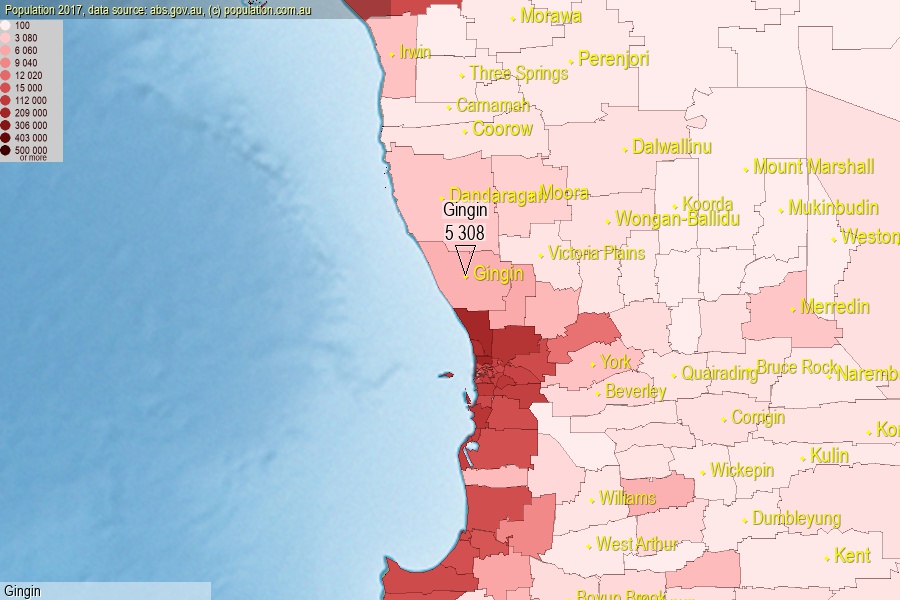
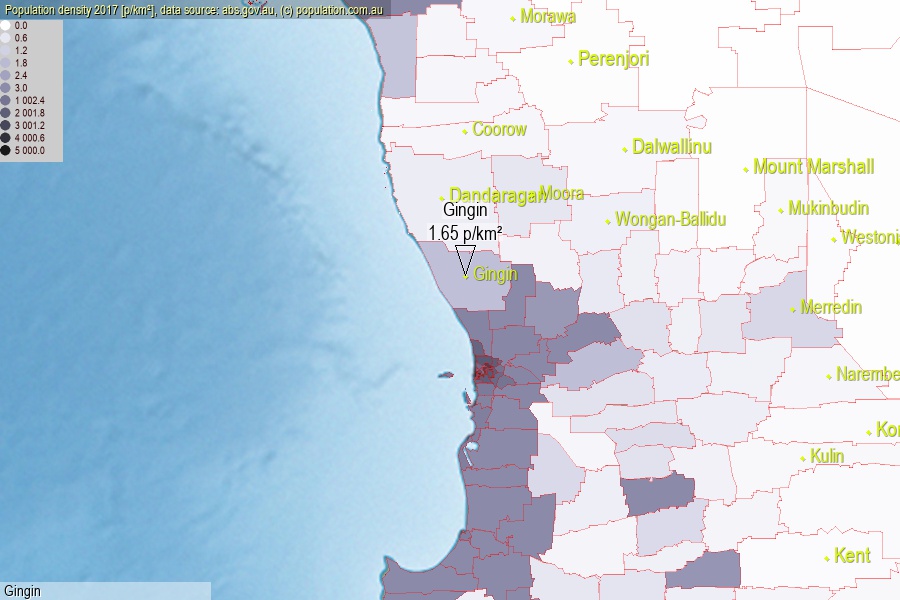
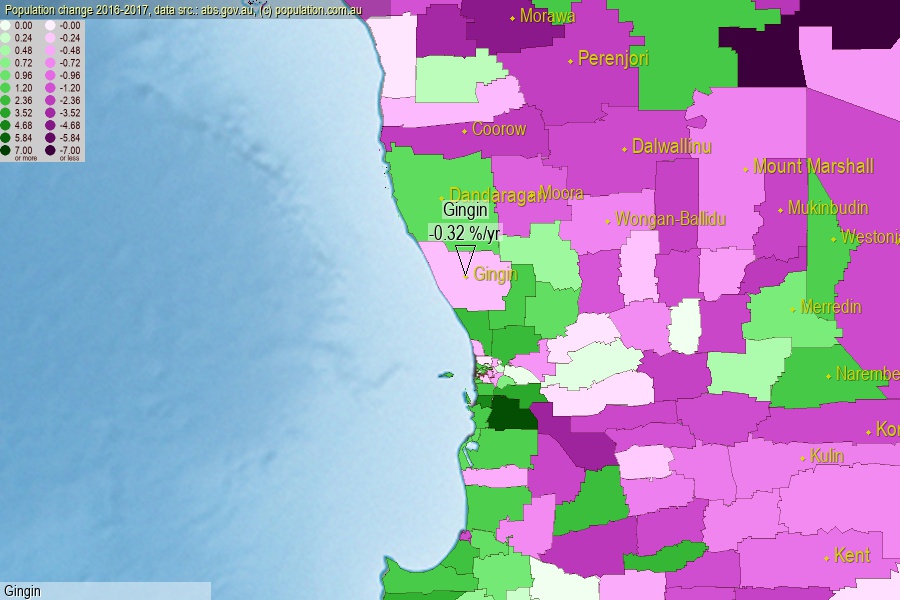
Click to enlarge. Gingin is located in the center of the images.
Population [people], population density [p./km²] and population change [%/year] [2]
[1996-2001] +4.18 %/Y
[2001-2002] +2.50 %/Y
[2002-2003] +1.83 %/Y
[2003-2004] +0.96 %/Y
[2004-2005] +0.67 %/Y
[2005-2006] +0.95 %/Y
[2006-2007] -0.07 %/Y
[2007-2008] +1.57 %/Y
[2008-2009] +2.63 %/Y
[2009-2010] +0.38 %/Y
[2010-2011] +0.75 %/Y
[2011-2012] +3.57 %/Y
[2012-2013] +5.47 %/Y
[2013-2014] +1.69 %/Y
[2014-2015] -0.09 %/Y
[2015-2016] -0.49 %/Y
[2016-2017] -0.32 %/Y
[0] Calculated with linear interpolation from officially estimated population
[1] Read more about LGA and Australian Statistical Geography Standard (ASGS) on abs.gov.au
[2] Population data from Australian Bureau of Statistics (Population and density: 2017; change: 2016-2017)
[3] Digital Boundaries: Australian Statistical Geography Standard (ASGS) 2016.